
Ascot Draw Bias: Stall Positions That Shape Royal Ascot Results
Best Horse Racing Betting Sites – Bet on Horse Racing in 2026
Loading...
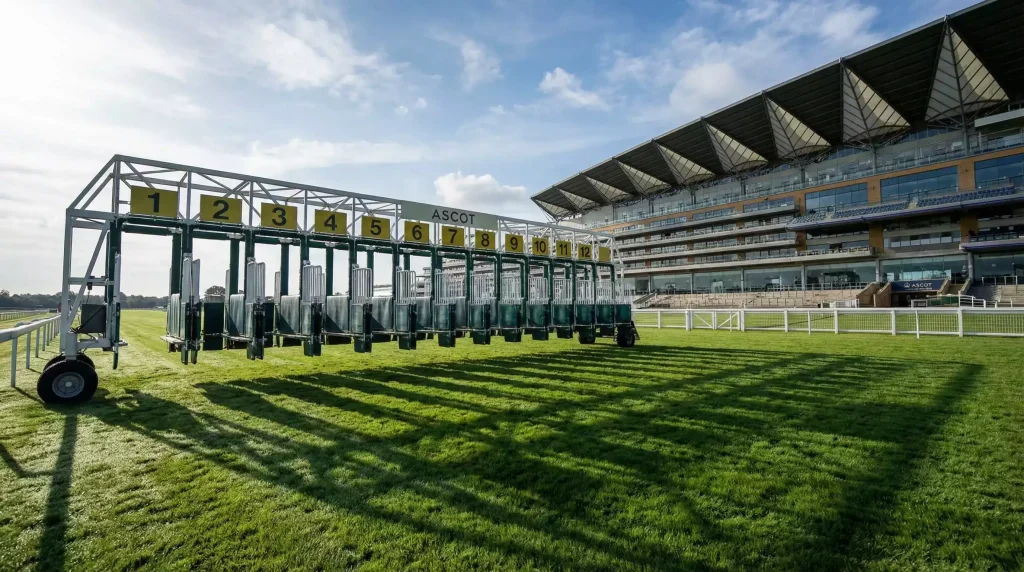
Why Stall Position Decides Races at Ascot
The British Horseracing Authority allocates starting stalls randomly. A horse drawn one has no intrinsic advantage over a horse drawn twenty—in theory. In practice, Ascot Racecourse distorts that equality through track geometry, rail positioning, and ground conditions that combine to create persistent, measurable biases.
Understanding ascot draw bias separates informed punters from those betting blind. A strongly fancied horse in the wrong stall faces obstacles invisible to form readers who ignore draw data. A moderate horse in the right stall can outrun its rating through positional advantage alone. Ignoring draw at Royal Ascot is like ignoring ground conditions or jockey bookings—a fundamental error that compounds over 35 races.
The bias operates differently across distances and race types. Six-furlong sprints on the straight course produce different patterns than mile handicaps. Round-course races introduce bend dynamics absent from straight-track events. And the relationship between draw and results shifts with ground conditions: good-to-firm racing produces one pattern; soft ground produces another, often more pronounced.
What follows is a detailed breakdown of draw bias by distance, supplemented by race-specific analysis for Royal Ascot’s most competitive handicaps. The data draws primarily from five-year samples—large enough to reveal genuine patterns rather than noise, recent enough to reflect current track configuration following the 2006 redevelopment. No bias is absolute; 20/1 shots from poor draws occasionally win, and favourites from prime stalls occasionally lose. But probability tilts, and tilts matter across a festival’s worth of betting.
Royal Ascot 2025 delivered confirmation of these patterns. “In terms of quality, quantity and competitiveness, the fields were fantastic all week,” observed Sam Nati, Head of Commingling at the Hong Kong Jockey Club, reflecting on a festival where draw analysis proved predictive more often than not.
Straight Course vs Round Course: Different Bias Profiles
Ascot features two distinct track configurations: the straight course for races up to one mile, and the round course for distances beyond. Each produces fundamentally different draw dynamics, and conflating them generates misleading conclusions.
The straight course runs directly toward the grandstands, with stalls positioned across the track’s width. Horses in high stalls race on the stands’ side—closer to the grandstand rail—while low-drawn horses race on the far side. The crown of the track, its highest point, sits roughly in the centre, with ground falling away slightly toward both rails. This camber affects drainage: rain runs off the centre toward the rails, leaving the middle often firmer than the sides.
Historically, the stands’ side holds an advantage on the straight course, particularly in larger fields where jockeys racing far side must cover more ground to contest the finish. This advantage is not universal—genuinely fast ground sometimes neutralises it—but it persists often enough to warrant serious attention when handicapping sprints and mile races.
The round course introduces bend dynamics. Races from seven furlongs to two and a half miles start on the spur that joins the main track, with runners taking a sweeping right-hand bend before entering the straight. Low draws position horses closer to the inside rail on this bend, theoretically saving ground. High draws force wider passage around the turn.
Yet the inside rail is not always advantageous. Track maintenance concentrates on the outside path, often leaving the rail churned and slower after several days of racing. By Saturday of Royal Ascot, low-drawn horses on the round course sometimes find themselves running on the worst ground despite the shortest route. The interaction of draw and going becomes essential.
Punters must think in terms of course type first, then distance, then specific race conditions. A draw study that lumps all Royal Ascot races together misses these structural differences and produces averages that obscure actionable patterns.
Six Furlongs: Middle-to-High Dominance
Six-furlong races at Royal Ascot run entirely on the straight course, starting from stalls positioned well up the track and finishing at the grandstand. Fields of up to thirty runners spread across the width of the track, making draw position a genuine variable rather than a marginal consideration.
Five-year level stakes profit data from OLBG reveals a striking outlier: stall 7 has produced an LSP of -75.25 over the sample period. That figure represents the worst return of any individual stall number at the distance—a statistical anomaly that nonetheless merits attention. Horses drawn seven find themselves trapped between those racing stands’ side and those racing centre track, often lacking the pace to cross over to their preferred side and finishing caught between groups.
Middle-to-high draws—stalls 10 through 20—have generally produced positive returns, with the stands’ side cohort outperforming when ground conditions favour that racing line. Low draws (1-5) show inconsistent results, occasionally winning when the far rail rides well but more often struggling to match pace with the main body of the field.
The King Charles III Stakes (formerly King’s Stand Stakes) at five furlongs presents a compressed version of this pattern. With fewer runners—typically 12-16—the bias is less pronounced, but high draws still outperform marginally. The Windsor Castle Stakes and Norfolk Stakes, with juvenile runners lacking straight-course experience, amplify draw importance further. Unraced horses default to racing where their jockey steers them; drawn low in a maiden field of two-year-olds often means racing far side alone.
Practical application: filter six-furlong selections strongly against stalls 1-7 unless compelling form or ground-condition reasoning overrides. Weight toward stalls 12-20 when the stands’ side bias is active, typically identifiable by results earlier on the card.
Seven Furlongs and One Mile: Shifting Patterns
The transition from six furlongs to seven introduces subtle but meaningful changes in draw dynamics. Seven-furlong races begin further back on the straight course, giving horses additional time to settle into racing positions before the final three-furlong climb to the line. That extra furlong slightly diminishes the urgency of early pace, allowing jockeys more flexibility to manoeuvre regardless of starting stall.
Nevertheless, high draws retain an edge at seven furlongs. Horses able to race stands’ side without expending excessive energy crossing the track finish more consistently in the places. The bias is less extreme than at six furlongs—perhaps 10-15% advantage rather than 20%+—but remains statistically significant across the Royal Ascot sample.
One-mile races present a different configuration. The round mile starts on the chute and features a bend before joining the straight with roughly three furlongs remaining. Here, draw interacts with pace scenarios. In strongly run races where leaders set genuine fractions, low draws can benefit from inside passage around the bend while high draws spend fuel maintaining position wide.
In slowly run miles with tactical finishes—common in Group 1 events like the Queen Anne—draw matters less. Horses cluster together through the bend, fan out entering the straight, and the finish depends more on acceleration than position. Royal Ascot Group races at a mile often unfold this way, reducing draw to a secondary factor behind class and form.
The Royal Hunt Cup—a mile handicap with thirty runners—restores draw importance dramatically. With a full field, the racing splits into distinct groups by draw, and crossing from far side to stands’ side mid-race becomes nearly impossible. High draws dominate recent renewals; horses below stall 10 face severe headwinds unless they break fast enough to establish stands’ side position before the field separates.
Assess mile races individually. Group races warrant less draw concern; handicaps warrant intense draw scrutiny.
Queen Mary Stakes: Twelve Consecutive High Stalls
The Queen Mary Stakes provides the most dramatic illustration of draw bias anywhere in British racing. This Group 2 sprint for two-year-old fillies has produced a winner from stall 10 or higher in every single running over the past twelve years, according to analysis from At The Races. Not eleven of twelve. Not ten of twelve. All twelve.
The pattern defies standard probability. In fields typically ranging from 15-24 runners, with roughly half starting from stalls below 10, random distribution would predict at least three or four low-drawn winners across a twelve-year sample. Instead, zero. The consistency suggests structural causation rather than variance.
Several factors may contribute. Two-year-old fillies with limited racecourse experience tend to race greener than older horses, following their jockeys’ steering without independent positional sense. Jockeys from high draws gravitate naturally toward the stands’ rail, while those from low draws must make active decisions about crossing over or committing to the far side. In a field of inexperienced runners, that decision-making under pressure often leads to errors—racing alone far side, covering excessive ground, or getting shuffled back in traffic.
Additionally, the pace scenario in juvenile sprints tends toward early chaos. Horses breaking at varying speeds, some slightly slowly, some keenly, create unpredictable formations in the first furlong. High-drawn runners can recover from slow starts by angling toward the stands’ rail; low-drawn runners who break slowly have nowhere obvious to go.
The practical implication is severe: horses drawn below stall 10 in the Queen Mary face historical headwinds so strong that backing them requires exceptional confidence in their ability to overcome structural disadvantage. Even talented fillies—potential Group 1 winners later in their careers—struggle to beat the draw here.
When analysing Queen Mary contenders, weight draw as heavily as form. A moderate filly from stall 18 holds better historical support than a standout filly from stall 4.
Britannia Handicap: Stalls 15+ Rule
The Britannia Stakes occupies a unique position in the Royal Ascot programme: a heritage handicap restricted to three-year-olds over a mile, typically attracting 25-30 runners and generating enormous each-way interest. The race has also developed one of the most reliable draw biases in the festival.
Six of the past seven Britannia winners started from stall 15 or higher. The At The Races draw database confirms this concentration in high stalls, a pattern that aligns with the Royal Hunt Cup but applies even more consistently here due to the three-year-old restriction.
Why do high draws dominate? The Britannia typically runs at strong pace, with several front-runners in full fields creating genuine gallop from the start. Three-year-olds, less seasoned than older handicappers, often struggle to settle in behind this early pace and commit positional errors mid-race. Horses drawn high can press forward stands’ side with clear passage; horses drawn low must either commit to a far-side group that may lack support or attempt a difficult cross to the favoured rail under racing pressure.
The handicap element adds another layer. Weights compress ability differences, meaning positional advantage matters more than in conditions races where class differentials allow superior horses to overcome poor draws. A seven-pound weight pull cannot compensate for racing the slower ground far side when the main pace unfolds stands’ side.
Punters should treat the Britannia with stall-first analysis. Identify the cohort of horses drawn 15-30 and work backward from there, assessing form, trainer record, and price within that subset. A horse with perfect form from stall 6 represents a marginal play at best; a slightly inferior form profile from stall 22 offers better historical support.
Enhanced each-way terms—six or seven places—further tilt the maths toward high-drawn selections, where place probability clusters more reliably than win probability.
Buckingham Palace: The Stall 26 Phenomenon
The Buckingham Palace Stakes pushes draw bias to its logical extreme. This seven-furlong handicap, typically attracting full fields of 25-30 runners, has produced a winner from stall 26 in six of its past seven renewals. Not “approximately stall 26” or “high twenties”—stall 26 specifically, according to historical race records.
Statistical improbability this extreme invites skepticism. Could the pattern be coincidence, set to regress immediately once punters pile onto stall 26 runners? Possibly. Racing contains random variance, and small samples—seven runnings—can produce misleading signals. Yet the consistency aligns with broader Ascot draw tendencies: stands’ side advantage, amplified by large fields, further amplified by the specific configuration of the seven-furlong start.
Stall 26 positions runners at the extreme stands’ side end of the stalls. From there, jockeys face no decision-making: race stands’ side or nothing. That clarity eliminates mid-race positional errors. Horses break, race their natural line toward the rail, and benefit from inside passage without needing to fight for position. Lower-drawn horses, meanwhile, must sort themselves into groups, often losing ground and expending energy in the process.
The Buckingham Palace runs on Friday afternoon, by which point several days of racing have been contested on the straight course. Track conditions often develop by then, with the far side more cut up than the stands’ rail. Stall 26 horses inherit the freshest ground in addition to the shortest route.
Practical application requires balance. Backing every stall 26 runner blindly would be foolish; they still need ability and competitive handicap marks. But a competent horse from stall 26 should receive serious consideration regardless of other factors. The historical precedent is too consistent to dismiss, and the structural reasoning—clearest path to favoured ground—supports the data rather than contradicting it.
Ascot Stakes: Low Stalls on the Long Distance
The Ascot Stakes inverts the sprint-distance patterns. At two and a half miles—the longest flat race in the Royal Ascot programme—low draws hold a meaningful advantage over high draws. The race begins on the round course and covers nearly two full circuits before entering the straight, making inside rail position valuable rather than detrimental.
Horses drawn low can settle against the inside rail immediately and hold that position through the extended journey, saving ground on every bend. Over two and a half miles, those saved lengths accumulate. A horse that travels 20 yards shorter than its rivals through superior positioning arrives at the final furlong fresher and closer, often making the difference in attritional staying contests.
High draws face the opposite challenge: either use energy to secure inside position early, burning reserves needed later, or accept racing wide throughout, covering more ground than rivals on a course that amplifies distance differentials.
The Ascot Stakes field typically features stamina specialists—horses bred and trained for extreme distances, often with mixed flat and jumps backgrounds. Pace tends toward steady rather than frantic; front-runners do not burn off challengers as in sprints but rather maintain energy conservation for a final test of stamina. In this scenario, positional economy matters immensely.
When assessing Ascot Stakes contenders, invert your sprint-race thinking. Favour low draws (1-8) and penalise high draws (15+) unless a horse’s class advantage clearly overrides positional disadvantage. Stayers from double-digit draws need exceptional ability to overcome the mileage differential—possible, but statistically disfavoured.
Similar principles apply to the Queen’s Vase at 14 furlongs and other extended round-course events: inside draws save ground, and saving ground matters more as distance increases.
Going and Draw Interaction: Soft Ground Amplifies Bias
All draw bias analysis contains an implicit assumption: that ground conditions remain consistent. When the going changes, bias changes with it. At Ascot, this interaction follows predictable patterns that punters can anticipate and exploit.
Good-to-firm or firm ground—typical of Royal Ascot in recent years—produces relatively neutral racing surfaces across the track width. The stands’ side advantage persists but moderates; horses drawn low can occasionally compete when the far rail rides genuinely fast. Genuine firm ground sometimes even neutralises bias entirely, creating racing where form and class dominate draw.
Soft ground transforms the equation. Rain softens the far side of the straight course more significantly than the stands’ side, where better drainage and slightly higher elevation preserve going quality. The already-present stands’ side bias amplifies dramatically when the going turns soft or heavy. Horses drawn low face not just positional disadvantage but ground disadvantage—slower, more energy-sapping surface beneath their hooves.
June weather in southern England is unpredictable. Royal Ascot has experienced firm ground that baked hard through five days and soft ground that forced rail movements mid-meeting. Monitoring weather forecasts and official going reports throughout the week is not optional—it is essential for adjusting draw-based selections in real time.
If rain arrives overnight before Wednesday racing, reassess all straight-course selections made on Tuesday. Horses selected despite moderate draws may now face severe disadvantage. Horses that looked questionable from high draws become stronger propositions. The willingness to revise based on new information separates professional approach from recreational guesswork.
Rail movements also affect draw calculations. When the course executive moves the rail—positioning it differently from the previous day—the effective draw changes. Stall 15 after a rail movement may occupy the ground that stall 18 occupied the day before. Tracking these movements, typically announced on raceday morning, ensures your analysis reflects actual conditions rather than assumptions.
Practical Application: Filtering Your Selections
Understanding ascot draw bias in theory matters less than applying it systematically in practice. Here is a framework for integrating draw analysis into your Royal Ascot betting process, from first glance at the racecard to final selection.
Begin with a race-type classification. Is this a straight-course event (up to one mile) or round-course event (beyond one mile)? Straight-course races default to stands’ side preference; round-course races require distance-specific assessment. Two-mile-plus races favour low draws; middle-distance round-course races depend on pace scenarios.
Next, note field size. In fields of twelve or fewer, draw bias diminishes significantly—horses can manoeuvre across the track without excessive ground loss. Handicaps with twenty-plus runners maximise draw importance; Group races with ten runners minimise it. Your draw filter should tighten as field size increases.
Check race-specific historical data. The Queen Mary, Britannia, Buckingham Palace, and Royal Hunt Cup have established patterns strong enough to override general track bias. Other races—the Jersey Stakes, the Wolferton—may show weaker or inconsistent draw tendencies that warrant less confident filtering.
Assess going conditions before applying your filter. Firm ground loosens the filter; soft ground tightens it. If rain has fallen overnight and the going report reads “good to soft, soft in places,” double your skepticism toward low-drawn runners on the straight course.
Now create two lists: horses you would consider without draw concern, and horses whose draws make them viable. Compare the lists. Where do they overlap? Those runners combine form appeal with positional advantage—your primary selections. Where do they conflict? Those runners require judgment calls about whether form overcomes draw or vice versa.
Finally, price-check your shortlist. A horse from a favourable draw is still a poor bet if the market has priced that advantage in. Look for runners where draw advantage is not fully reflected in odds—perhaps a horse at 16/1 from stall 24 that would be 10/1 from stall 6. That price differential represents your edge.
Repeat this process for every applicable race, adjusting filter strictness by race type and conditions. By the end of your analysis, draw has transformed from abstract concept to concrete selection tool—one that identifies opportunities invisible to punters ignoring stall positions.